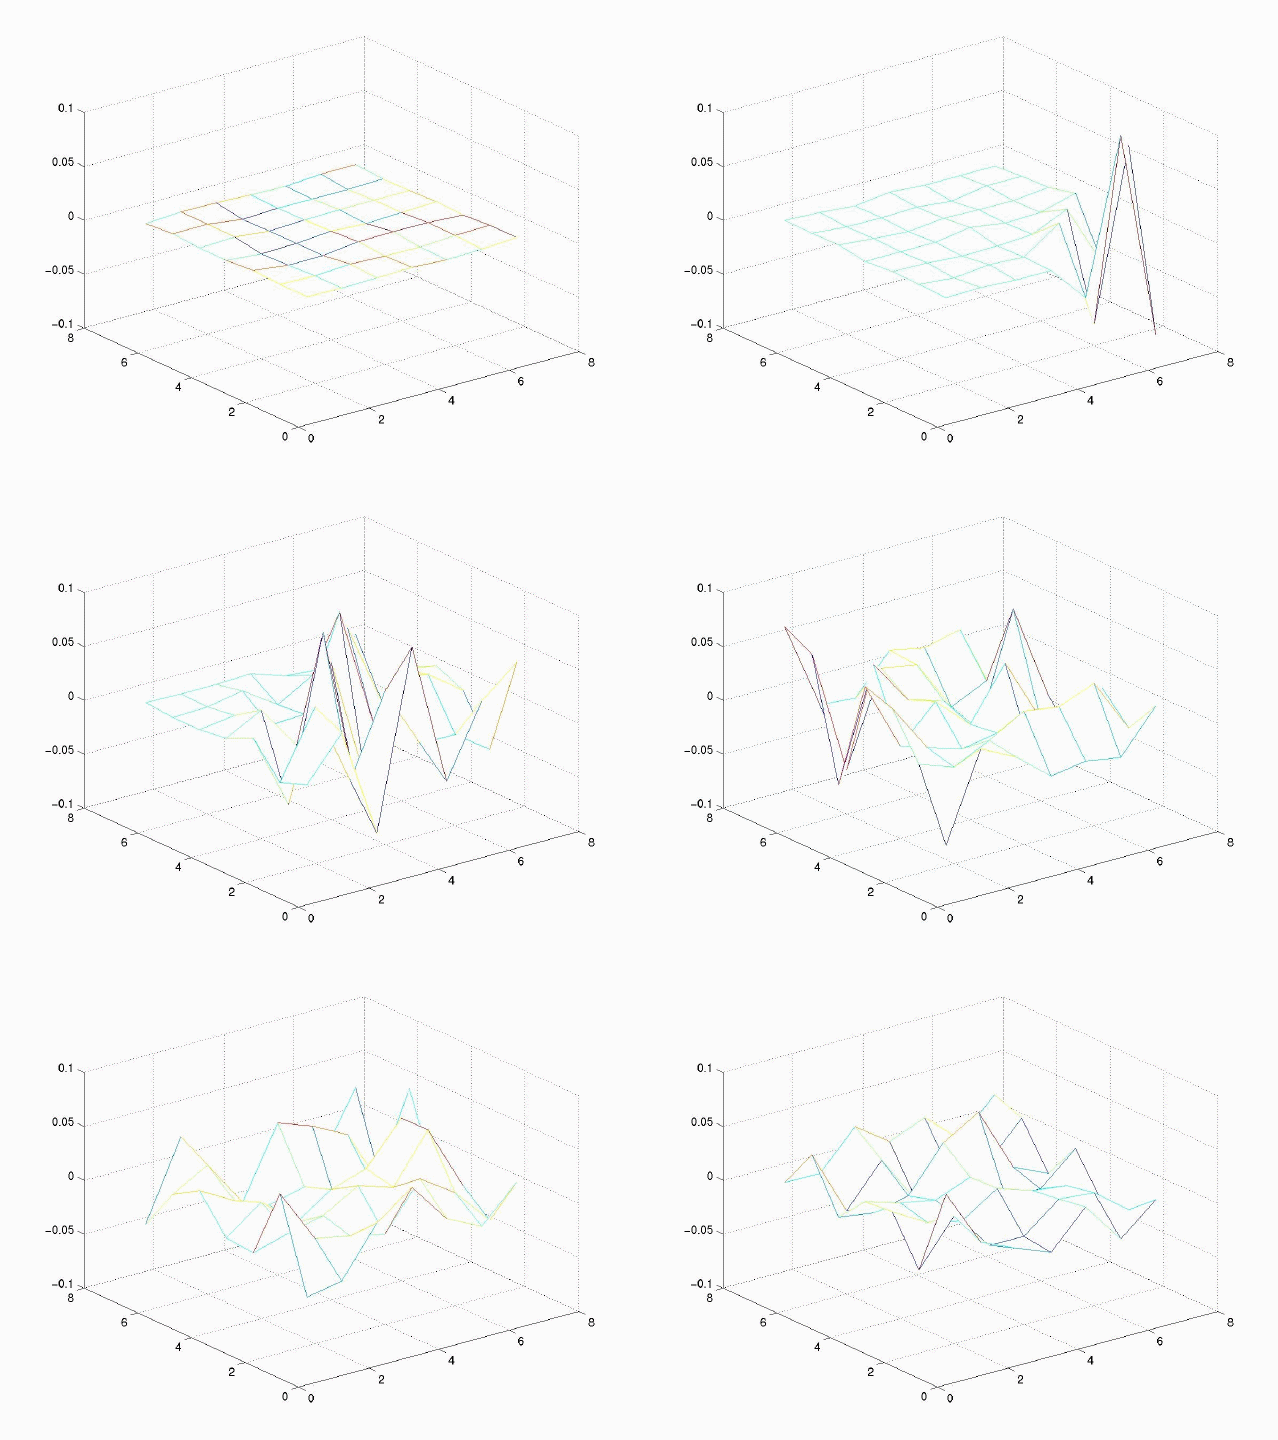
Waveform Display
We have performed arrays of propagation measurements in indoor environments using the pulse techniques described in the propagation measurement note. Although these measurements are made serially in time, the fixed trigger line from the transmitter clock to the receiving digital sampling oscilloscope allows them to be viewed as having been made simultaneously. In the motion picture below we have displayed these measurements as a function of time over the grid of measurement locations. The movie starts out with ambient measurement noise barely visible on a rectangular measurement field. A line-of-sight wave traverses the measurement array from right to left, followed almost immediately by multipath.
The analogy that comes to mind in observing this wave motion is that of a diver jumping into a calm swimming pool. The initial wave traveling outward from his entry into the pool is readily discernable, but once reflections from the boundaries of the pool interact, the surface of the pool becomes “choppy” and wavefronts are no longer easily detectable visually.
The following display is an animated gif file. The file is 4.9 Megabytes and may take some time to import depending on your connection. A downloadable version is available
here.


